Big Data, Data Mining & Data Warehouse – Complete Notes for IBPS, SSC, RRB & Govt Exams
Big Data, Data Mining, and Data Warehouse is a rapidly growing topic in IBPS, SSC CGL, RRB NTPC, and all government job exams, especially for IT-related roles. This post covers everything — definition and 5Vs of Big Data, Big Data tools (Hadoop, Spark, Kafka), Data Warehouse concepts, Data Mining, all four types of data analytics, OLAP vs OLTP, ETL process, Business Intelligence, and key data concepts — with memory tricks, one-liners, and 10 exam-focused FAQs.
Jump to section
- Introduction: Why This Chapter Matters in Modern Govt Exams
- What is Big Data?
- Big Data Tools and Technologies
- Data Warehouse
- Data Mining
- Types of Data Analytics
- OLAP vs OLTP
- ETL (Extract, Transform, Load)
- Business Intelligence (BI)
- Data Lake vs Data Warehouse
- Other Key Data Concepts
- Memory Tricks
- One-Liner Recap (Quick Revision)
Introduction: Why This Chapter Matters in Modern Govt Exams
We live in the Data Age. Every second, humans generate approximately 2.5 quintillion bytes of data — from social media posts and bank transactions to IoT sensor readings and satellite imagery. This explosion of data has created entirely new fields of technology: Big Data, Data Mining, Data Warehousing, and Business Intelligence.
For government job aspirants, this chapter is important for several reasons:
- Banking context: Banks analyse Big Data to detect fraud, predict loan defaults, personalise offers, and comply with regulations
- Government context: Aadhaar, GST, income tax — all massive government databases use data warehousing and analytics
- Exam frequency: Questions from this chapter appear in IBPS SO (IT), RBI Grade B, NABARD, and increasingly in IBPS PO/Clerk
Common exam questions include:
- "The 5 Vs of Big Data are ___?" → Volume, Velocity, Variety, Veracity, Value
- "Which tool is used for distributed processing of Big Data?" → Apache Hadoop
- "Data Warehouse is designed for ___ processing?" → OLAP
- "ETL stands for ___?" → Extract, Transform, Load
- "Predictive Analytics answers which question?" → What will happen?
This post covers every concept in this chapter — clearly, completely, and exam-ready.
What is Big Data?
Big Data refers to extremely large, complex datasets that cannot be captured, stored, managed, processed, or analysed using traditional database software tools within an acceptable time frame.
Simple Definition: Big Data = data so large and complex that conventional tools cannot handle it.
Where does Big Data come from?
- Social media — billions of posts, likes, shares, comments every minute (Facebook, Twitter, Instagram)
- Internet transactions — e-commerce orders, banking transactions, online bookings
- Machine/sensor data — IoT devices, smart meters, GPS tracking, industrial sensors
- Medical data — patient records, medical imaging, genomic sequences
- Government data — census, tax records, Aadhaar, traffic data, satellite data
- Web logs — every website visit, click, and search generates data
Scale of Big Data: The Internet generates approximately 120 zettabytes of data per year (2023). The human brain, if it were a hard drive, would hold about 2.5 petabytes. Big Data dwarfs all human-created information in history.
The 5 Vs of Big Data
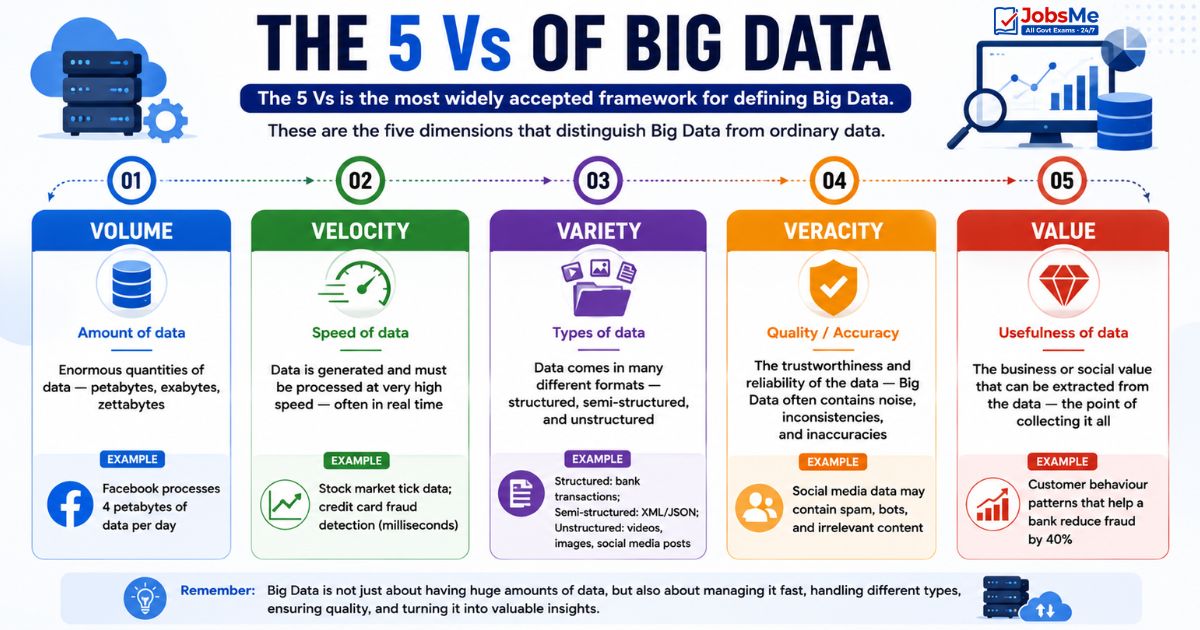
The 5 Vs is the most widely accepted framework for defining Big Data. These are the five dimensions that distinguish Big Data from ordinary data:
| V | Name | Description | Example |
|---|---|---|---|
| Volume | Amount of data | Enormous quantities of data — petabytes, exabytes, zettabytes | Facebook processes 4 petabytes of data per day |
| Velocity | Speed of data | Data is generated and must be processed at very high speed — often in real time | Stock market tick data; credit card fraud detection (milliseconds) |
| Variety | Types of data | Data comes in many different formats — structured, semi-structured, and unstructured | Structured: bank transactions; Semi-structured: XML/JSON; Unstructured: videos, images, social media posts |
| Veracity | Quality/Accuracy | The trustworthiness and reliability of the data — Big Data often contains noise, inconsistencies, and inaccuracies | Social media data may contain spam, bots, and irrelevant content |
| Value | Usefulness of data | The business or social value that can be extracted from the data — the point of collecting it all | Customer behaviour patterns that help a bank reduce fraud by 40% |
Exam Tip: Originally there were 3 Vs (Volume, Velocity, Variety). Veracity was added as the 4th V, and Value as the 5th. Some sources add a 6th V: Variability (inconsistency in data flow).
Characteristics of Big Data
Beyond the 5 Vs, Big Data has these key characteristics:
- Distributed — stored and processed across many machines (not one server)
- Heterogeneous — multiple different data formats and sources
- Time-sensitive — value of data often decreases rapidly with age
- Cannot fit in traditional relational databases — requires specialised tools
- Requires new computing paradigms — parallel processing, distributed computing
Big Data Tools and Technologies
Processing Big Data requires specialised software frameworks designed for distributed computing — splitting work across hundreds or thousands of servers simultaneously.
Apache Hadoop
| Feature | Details |
|---|---|
| Full Name | Apache Hadoop |
| Type | Open-source distributed storage and processing framework |
| Developed by | Apache Software Foundation (originally by Doug Cutting and Mike Cafarella at Yahoo!, inspired by Google's papers) |
| How it works | Uses HDFS (Hadoop Distributed File System) to store data across many servers; uses MapReduce to process data in parallel |
| MapReduce | A programming model that breaks processing into two phases: Map (distribute work) and Reduce (aggregate results) |
| Strength | Extremely scalable — can process petabytes of data across thousands of commodity servers |
| Weakness | Slow for real-time processing; designed for batch processing |
| Exam Key | Hadoop = open-source + distributed + HDFS + MapReduce; Big Data's foundational framework |
Key Hadoop Components:
| Component | Purpose |
|---|---|
| HDFS | Hadoop Distributed File System — stores data across multiple nodes with replication |
| MapReduce | Parallel processing engine — Map phase distributes work; Reduce phase aggregates |
| YARN | Resource manager — allocates CPU/memory across the cluster |
| ZooKeeper | Coordinates distributed services |
Apache Spark
| Feature | Details |
|---|---|
| Full Name | Apache Spark |
| Type | Fast, general-purpose cluster computing framework |
| Key Advantage | In-memory processing — keeps data in RAM instead of writing to disk between processing steps; up to 100× faster than Hadoop MapReduce |
| Supports | Batch processing, real-time streaming, machine learning (MLlib), graph processing (GraphX), SQL queries (Spark SQL) |
| Languages | Scala, Python, Java, R |
| Strength | Much faster than Hadoop; versatile (batch + streaming + ML); easy to use |
| Exam Key | Spark = faster than Hadoop + in-memory + real-time capable |
Apache Kafka
| Feature | Details |
|---|---|
| Full Name | Apache Kafka |
| Type | Distributed event streaming platform |
| What it does | A high-throughput, fault-tolerant message queue that handles real-time data streams — producers send messages; consumers receive them |
| Strength | Handles millions of events per second with very low latency |
| Used for | Real-time data pipelines, activity tracking, log aggregation, fraud detection streams |
| Exam Key | Kafka = real-time streaming + event-driven + message queue |
Apache Hive
| Feature | Details |
|---|---|
| Full Name | Apache Hive |
| Type | Data warehouse software built on top of Hadoop |
| What it does | Provides a SQL-like query interface (HiveQL) to query data stored in HDFS — allows analysts to use familiar SQL instead of complex MapReduce programs |
| Strength | Makes Hadoop accessible to SQL users; good for batch analytics |
| Exam Key | Hive = SQL-like queries on Hadoop data = HiveQL |
Apache HBase
| Feature | Details |
|---|---|
| Full Name | Apache HBase |
| Type | NoSQL, column-family database built on top of Hadoop/HDFS |
| What it does | Provides real-time, random read/write access to Big Data stored in Hadoop — fills the gap where Hadoop+MapReduce is too slow |
| Based on | Google's Bigtable paper |
| Exam Key | HBase = NoSQL + real-time access + runs on Hadoop |
Big Data Tools - Summary Table
| Tool | Type | Key Feature | Use Case |
|---|---|---|---|
| Hadoop | Framework | HDFS + MapReduce; batch; very scalable | Large-scale batch processing |
| Spark | Framework | In-memory; 100× faster; real-time | Fast batch + streaming + ML |
| Kafka | Streaming | Real-time event streaming | Real-time data pipelines |
| Hive | Query layer | SQL on Hadoop (HiveQL) | Data warehouse analytics on Hadoop |
| HBase | NoSQL DB | Real-time NoSQL on HDFS | Real-time random access to big data |
Data Warehouse
A Data Warehouse (DW) is a centralised repository that stores integrated, historical data from multiple different source systems, specifically designed for analysis and reporting rather than day-to-day transaction processing.
Formal Definition:
A Data Warehouse is a subject-oriented, integrated, time-variant, and non-volatile collection of data in support of management's decision-making process. — Bill Inmon (Father of Data Warehousing)
Real-World Example: A bank's Data Warehouse collects data from:
- Core banking system (accounts, transactions)
- Loan management system
- Credit card system
- ATM network
- Mobile banking app
- Customer service CRM
This integrated data enables the bank to analyse customer behaviour, identify cross-selling opportunities, detect fraud patterns, and comply with regulatory reporting — all from one unified source.
Key Characteristics of a Data Warehouse
| Characteristic | Meaning |
|---|---|
| Subject-Oriented | Organised around key business subjects (Customers, Products, Sales, Accounts) — not around operational processes |
| Integrated | Data from multiple, different source systems is consolidated, cleaned, and made consistent |
| Time-Variant | Stores historical data over time — you can see what the data looked like 5 years ago; timestamps are crucial |
| Non-Volatile | Data is loaded in bulk and not modified or deleted — once entered, it stays for analysis; no daily CRUD operations |
Also called: Enterprise Data Warehouse (EDW)
Data Warehousing Process
The process of building and populating a Data Warehouse involves three main activities:
| Activity | Description |
|---|---|
| Data Cleaning | Identifying and correcting errors, inconsistencies, duplicates, and missing values in source data before loading |
| Data Integration | Combining data from multiple different source systems into a unified, consistent format |
| Data Consolidation | Physically storing the integrated, cleaned data in the warehouse repository |
Data Warehouse vs Operational Database
| Feature | Data Warehouse (OLAP) | Operational Database (OLTP) |
|---|---|---|
| Purpose | Analysis and reporting | Day-to-day transaction processing |
| Data type | Historical, integrated, consolidated | Current, operational data |
| Operations | Complex queries, aggregations, trends | Simple inserts, updates, deletes |
| Users | Analysts, managers, executives | Operational staff, applications |
| Data updates | Periodic batch loads | Continuous real-time |
| Query complexity | Complex, multi-table | Simple, pre-defined |
| Optimised for | Read performance (SELECT) | Write performance (INSERT/UPDATE) |
| Examples | Teradata, Amazon Redshift, Snowflake | Oracle, MySQL, SQL Server |
Data Mining
Data Mining is the process of discovering patterns, correlations, trends, and useful insights from large datasets using statistical, mathematical, and machine learning techniques.
Also called: Knowledge Discovery in Databases (KDD), data or knowledge discovery, data dredging, data fishing, data snooping
Simple Analogy: Just as mining for gold involves sifting through tons of rock to find valuable ore, data mining sifts through mountains of data to find valuable patterns and insights.
Data Mining in Banking:
- Detecting credit card fraud (unusual transaction patterns)
- Predicting loan defaults (risk assessment)
- Customer segmentation (grouping customers by behaviour)
- Cross-selling recommendations (customer who has savings account → offer FD)
- Detecting money laundering (suspicious transaction patterns)
Data Mining Techniques
| Technique | Description | Example |
|---|---|---|
| Classification | Assigns data items to predefined categories | Classifying loan applications as "approve" or "reject" |
| Clustering | Groups similar data items together without predefined categories | Grouping customers by spending behaviour |
| Association Rule Mining | Finds items that frequently appear together | "Customers who buy X also buy Y" — market basket analysis |
| Regression | Predicts a continuous numerical value | Predicting a customer's likely credit limit |
| Anomaly/Outlier Detection | Identifies unusual data points that don't fit normal patterns | Fraud detection — unusual transaction amounts |
| Sequential Pattern Mining | Finds patterns in sequences of events over time | Customer journey analysis — which products do customers buy first, second, third |
Data Mining Process (CRISP-DM)
The industry-standard data mining process follows these steps:
- Business Understanding — Define the problem and objectives
- Data Understanding — Collect and explore data; identify quality issues
- Data Preparation — Clean, transform, and select relevant data (most time-consuming step)
- Modelling — Apply data mining algorithms and build models
- Evaluation — Assess model quality and check if business objectives are met
- Deployment — Implement the model in production systems
Types of Data Analytics
Data analytics is classified into four types based on what question they answer and how much insight they provide:
Descriptive Analytics
| Feature | Details |
|---|---|
| Question answered | "What happened?" |
| Purpose | Summarises and describes historical data — tells you what has already occurred |
| Techniques | Averages, totals, percentages, charts, dashboards |
| Example | "Total bank transactions last quarter were ₹5,000 crore — up 12% from last year" |
| Tools | Excel pivot tables, Power BI dashboards, Google Analytics |
| Exam Key | Descriptive = Past = What happened? |
Diagnostic Analytics
| Feature | Details |
|---|---|
| Question answered | "Why did it happen?" |
| Purpose | Investigates the root cause of a specific event or trend — explains the "why" behind the "what" |
| Techniques | Drill-down, data discovery, correlation analysis |
| Example | "Why did loan defaults increase by 15% in Q3? — Analysis shows 73% of defaults were in the MSME segment, driven by GST implementation delays" |
| Exam Key | Diagnostic = Root Cause = Why did it happen? |
Predictive Analytics
| Feature | Details |
|---|---|
| Question answered | "What will happen?" |
| Purpose | Uses historical data and statistical models to forecast future outcomes |
| Techniques | Machine learning, statistical modelling, regression, neural networks |
| Example | "Based on customer behaviour patterns, this customer has a 78% probability of defaulting on their loan in the next 6 months" |
| Tools | Python (scikit-learn), R, SAS, IBM SPSS |
| Exam Key | Predictive = Future = What will happen? (Forecasting) |
Prescriptive Analytics
| Feature | Details |
|---|---|
| Question answered | "What should we do?" |
| Purpose | Recommends specific actions to achieve desired outcomes — the most advanced form of analytics |
| Techniques | Optimisation, simulation, decision trees, reinforcement learning |
| Example | "To reduce loan defaults, increase the minimum credit score threshold from 650 to 720 for personal loans above ₹5 lakh in Tier-3 cities" |
| Exam Key | Prescriptive = Action/Decision = What should we do? |
Analytics Types - Complete Summary:
| Type | Question | What It Does | Complexity |
|---|---|---|---|
| Descriptive | What happened? | Describes the past | Low |
| Diagnostic | Why did it happen? | Explains causes | Medium |
| Predictive | What will happen? | Forecasts the future | High |
| Prescriptive | What should we do? | Recommends actions | Highest |
OLAP vs OLTP
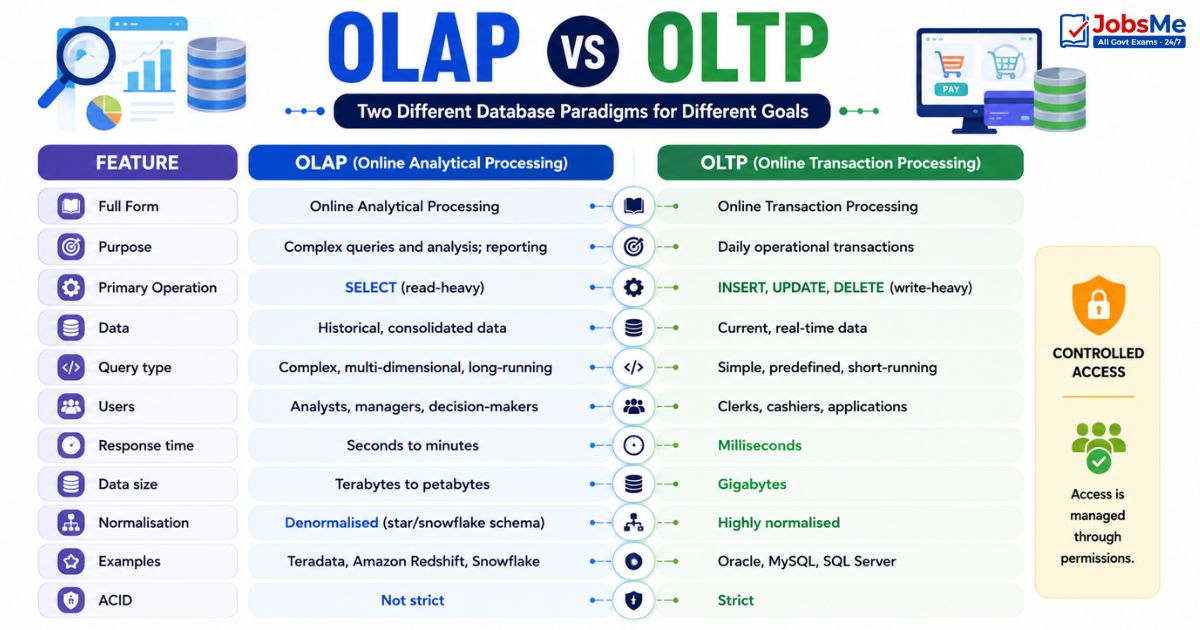
OLAP and OLTP are two fundamentally different database system paradigms:
| Feature | OLAP (Online Analytical Processing) | OLTP (Online Transaction Processing) |
|---|---|---|
| Full Form | Online Analytical Processing | Online Transaction Processing |
| Purpose | Complex queries and analysis; reporting | Daily operational transactions |
| Primary Operation | SELECT (read-heavy) | INSERT, UPDATE, DELETE (write-heavy) |
| Data | Historical, consolidated data | Current, real-time data |
| Query type | Complex, multi-dimensional, long-running | Simple, predefined, short-running |
| Users | Analysts, managers, decision-makers | Clerks, cashiers, applications |
| Response time | Seconds to minutes | Milliseconds |
| Data size | Terabytes to petabytes | Gigabytes |
| Normalisation | Denormalised (star/snowflake schema) | Highly normalised |
| Examples | Teradata, Amazon Redshift, Snowflake | Oracle, MySQL, SQL Server |
| ACID | Not strict | Strict |
Banking Examples:
- OLTP: A customer withdrawing ₹5,000 from an ATM — real-time; updates balance immediately
- OLAP: Bank's risk team running a query to find all customers with >3 transactions above ₹1 lakh in the past 90 days — complex; runs on the data warehouse
ETL (Extract, Transform, Load)
ETL is the three-step process of moving data from source systems into a Data Warehouse:
| Phase | Name | Description |
|---|---|---|
| E — Extract | Extract | Pull data from multiple different source systems (OLTP databases, CRM, ERP, flat files, APIs) |
| T — Transform | Transform | Clean, validate, and convert the extracted data into the required format — handle missing values, remove duplicates, standardise formats, apply business rules |
| L — Load | Load | Write the transformed data into the target Data Warehouse |
Why ETL matters: Raw data from different source systems is inconsistent — different date formats, different customer ID formats, duplicate records, missing values. ETL ensures only clean, consistent, high-quality data enters the Data Warehouse.
Modern variant: ELT (Extract, Load, Transform) — first load raw data into the warehouse, then transform using the warehouse's processing power — used in cloud data warehouses (Snowflake, BigQuery).
Business Intelligence (BI)
Business Intelligence (BI) is the set of technologies, processes, tools, and practices that organisations use to collect, analyse, and present business data to support better decision-making.
BI Stack: Data Sources → ETL → Data Warehouse → BI Tools → Reports & Dashboards → Decision Makers
| BI Tool | Company | Notes |
|---|---|---|
| Power BI | Microsoft | Most widely used enterprise BI tool |
| Tableau | Salesforce | Powerful data visualisation; intuitive |
| Looker | Cloud-native BI; integrated with BigQuery | |
| QlikView / Qlik Sense | Qlik | In-memory analytics |
| SAP BusinessObjects | SAP | Enterprise BI suite |
Key BI Concepts:
- Dashboard — Visual summary of key metrics displayed on one screen
- KPI (Key Performance Indicator) — Measurable value tracking how effectively an organisation achieves objectives
- Data Visualisation — Representing data graphically (charts, graphs, maps) to make patterns visible
Data Lake vs Data Warehouse
| Feature | Data Lake | Data Warehouse |
|---|---|---|
| Data type | Raw, unprocessed data in native format | Processed, structured, clean data |
| Schema | Schema-on-read (defined when reading) | Schema-on-write (defined at ingestion) |
| Users | Data scientists, ML engineers | Business analysts, executives |
| Cost | Lower storage cost | Higher storage cost |
| Query | Complex; requires data engineering | Standard SQL; user-friendly |
| Purpose | Store everything; analyse later | Store relevant; analyse now |
| Technology | Hadoop HDFS, Amazon S3, Azure Data Lake | Teradata, Snowflake, Amazon Redshift |
| Agility | More flexible | Less flexible but more structured |
Simple Analogy:
- Data Lake = A large natural lake — you can dump water from any source; it stores everything in its natural state; but you need special equipment to use the water productively
- Data Warehouse = A water treatment plant with storage tanks — water is cleaned, tested, and stored in specific containers; easy to use directly
Other Key Data Concepts
| Term | Meaning |
|---|---|
| Data Science | Interdisciplinary field that uses statistics, programming (Python/R), and domain expertise to extract knowledge and insights from data |
| Machine Learning | A subset of AI where systems learn from data and improve performance without explicit programming |
| Data Visualisation | The graphical representation of data — charts, graphs, maps, dashboards — to make patterns and insights visible |
| Metadata | "Data about data" — descriptive information about other data (file size, creation date, author, data type, table structure) |
| Data Governance | Framework of policies and standards for managing data quality, security, privacy, and integrity across an organisation |
| Master Data | Core business data that is shared across systems — customer data, product data, employee data |
| Data Redundancy | Same data stored in multiple places — wastes storage; causes inconsistency when updates are missed |
| Data Quality | The degree to which data is accurate, complete, consistent, and fit for its intended purpose |
| Vector Database | A specialised database that stores AI embeddings (numerical vector representations of text, images, audio) — used in generative AI applications (e.g., Pinecone, ChromaDB, Weaviate) |
| Data Fabric | An architecture that provides consistent data access and management across hybrid and multi-cloud environments |
| Feature Store | A centralised repository for storing and managing machine learning features (processed input variables) |
Memory Tricks
🔑 5 Vs of Big Data — "VVV VV":
Volume | Velocity | Variety | Veracity | Value Mnemonic: "Very Very Very Valuable Ventures" Or: "5 Vs = Volume(How much), Velocity(How fast), Variety(What types), Veracity(How accurate), Value(Why bother)"
🔑 Hadoop vs Spark:
Hadoop = Hard disk based; Heavy batch; Huge scalability Spark = Speed; Stream (real-time); SMArt (in-memory) "Spark is Faster than Hadoop" = S > H in speed (alphabetically too — S comes after H!)
🔑 Analytics Types — "DDPP":
Descriptive = Did it happen? (Past) Diagnostic = Determined why? (Cause) Predictive = Predicts future (Forecast) Prescriptive = Prescribes action (Decision) Mnemonic: "Doctors Diagnose, Patients Predict Prescriptions"
🔑 OLAP vs OLTP:
OLAP = Analysis = Ask complex questions = Data Warehouse OLTP = Transaction = Today's operations = Day-to-day database "OLAP Analyses; OLTP Transacts"
🔑 ETL Process:
Extract (pull from source) → Transform (clean and convert) → Load (store in warehouse) Mnemonic: "Every Tiger Leaps" = Extract Transform Load
🔑 Data Lake vs Data Warehouse:
Lake = Raw water (dump everything; schema later) Warehouse = Clean storage (structured; ready to use) "Lake is lazy (raw); Warehouse is wise (processed)"
One-Liner Recap (Quick Revision)
- Big Data refers to extremely large and complex datasets that cannot be managed by traditional database tools — characterised by the 5 Vs: Volume, Velocity, Variety, Veracity, and Value.
- Volume refers to the enormous quantity of data generated (petabytes and exabytes); Velocity refers to the speed at which data is generated and must be processed in real time.
- Variety means Big Data comes in structured (databases), semi-structured (XML/JSON), and unstructured (videos, images, social media) formats simultaneously.
- Veracity refers to the trustworthiness and accuracy of Big Data — much of it contains noise, errors, and inconsistencies that must be addressed before analysis.
- Apache Hadoop is the foundational open-source framework for Big Data — it uses HDFS for distributed storage and MapReduce for parallel batch processing across commodity servers.
- Apache Spark is significantly faster than Hadoop (up to 100×) because it uses in-memory processing, making it suitable for both batch processing and real-time stream processing.
- Apache Kafka is a distributed event-streaming platform that handles real-time data streams at massive scale — used for data pipelines, activity tracking, and fraud detection.
- A Data Warehouse is a subject-oriented, integrated, time-variant, and non-volatile centralised repository designed for OLAP (Online Analytical Processing) — analysis and reporting.
- ETL (Extract, Transform, Load) is the three-step process of extracting data from source systems, transforming (cleaning/converting) it, and loading it into a Data Warehouse.
- Data Mining is the process of discovering hidden patterns, correlations, and insights from large datasets — also called Knowledge Discovery in Databases (KDD).
- Descriptive Analytics answers "What happened?" (historical), Diagnostic answers "Why did it happen?" (root cause), Predictive answers "What will happen?" (forecasting), and Prescriptive answers "What should we do?" (action recommendation).
- OLAP (Online Analytical Processing) is used for complex queries and analysis in Data Warehouses, while OLTP (Online Transaction Processing) handles day-to-day operational transactions.
- A Data Lake stores raw data in its native format with schema defined at read time — more flexible; while a Data Warehouse stores processed, structured data with schema defined at write time — more queryable.
- Business Intelligence (BI) uses tools like Power BI and Tableau to convert data warehouse data into visual dashboards, reports, and KPIs for management decision-making.
- A Vector Database stores AI embeddings (numerical representations of text, images, audio) and is used in generative AI applications — examples include Pinecone, ChromaDB, and Weaviate.
Preparing for competitive exams requires consistent revision. Platforms like JobsMe simplify preparation through:
- Daily Current Affairs
- Weekly Current Affairs
- Monthly Current Affairs
- Static GK for Competitive Exams
- Latest Government Jobs Notifications
- Banking Awareness
Stay updated, revise regularly, and attempt quizzes for better accuracy in UPSC, SSC CGL, IBPS PO/Clerk, SBI, RBI Grade B, RRB NTPC, Defence, and State PSC exams.
Free quiz • No signup required
Put this topic into practice with Daily Current Affairs Quiz 10 June 2026 MCQs for UPSC, SSC, Banking, Railways, Defence & State PSC Exams. It is the quickest way to reinforce what you just learned.
Frequently Asked Questions
What is Big Data and what are its 5 Vs?
What is Apache Hadoop and how does it work?
What is the difference between Hadoop and Spark?
What is a Data Warehouse and how is it different from an operational database?
What is ETL and why is it important for Data Warehousing?
What are the four types of Data Analytics?
What is the difference between OLAP and OLTP?

About the author